
1. Introduction
As a developer, you may have tested the functionality of your code hundreds of times during development. This is known as functional testing. Despite how familiar you are with your product, users will approach it differently and have many different use cases. That’s why you need Non-Functional Testing (NFT).
Performance, Security, Usability, and Reliability are just some of the many NF aspects that can be tested to ensure a better user experience. Apache JMeter is one of the best ‘Open Source and Free Tool’ that you can use for NFT. It can be used to perform Load Testing, Performance Testing, Scalability Testing, and more.
2. Watch Installation Video
3. Download and Install
- Step 1: Install the latest version of the Java SE Development Kit. Download it here.
- Step 2: Download the latest JMeter binaries from here.
- Step 3: Install and launch JMeter as follows:
- Unzip the downloaded JMeter zip file to the intended install folder.
- Open the extracted folder and go to \Apache JMeter\apache-jmeter-5.2.1\bin.
- Run the ‘.bat‘ file and you are good to go.
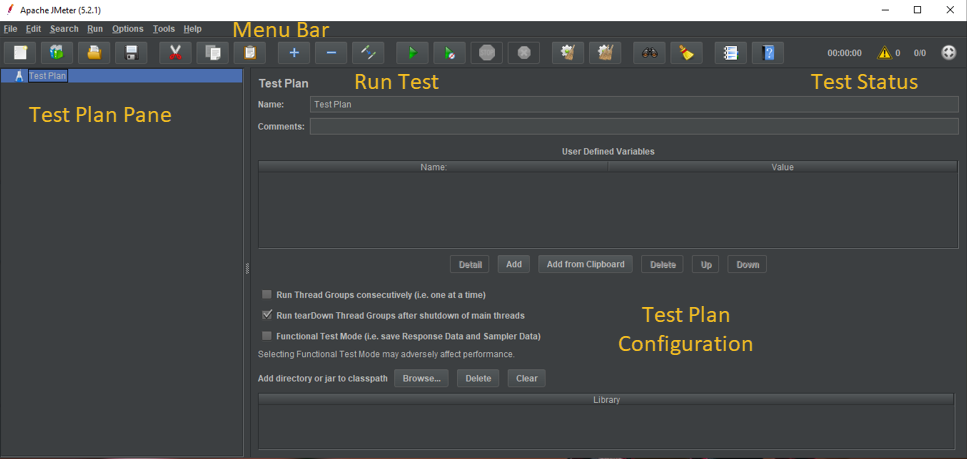
- Step 4: Identify the basic components of JMeter.
Now you have a basic idea of JMeter and its components. Let’s try a real-world example for a better understanding. Simply follow these steps to test youtube.com as our website.
4. Creating a Test Plan
Let’s start by creating a New Test Plan for our test.
- Start JMeter
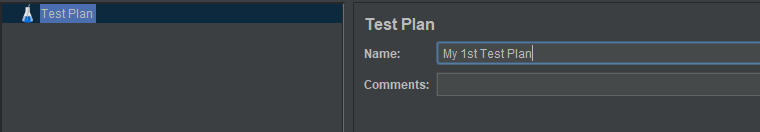
- Go to File > New and add a Test Plan and give it a name.
5. Adding a Thread Group
This section details setting up a certain number of Threads that will be used for our test. You can do so by following these steps:
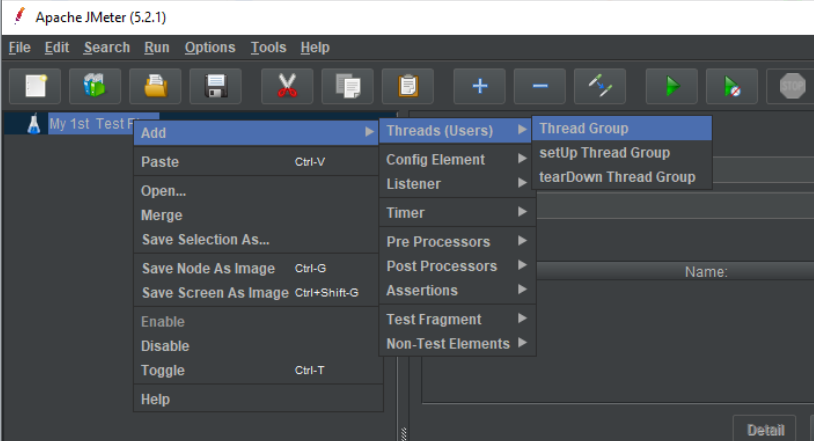
- Right-click on the newly created Test Plan which will be displayed in the Test Plan Pane.
- Click Add > Threads (Users) > click Thread Group
Then you have to add the thread properties by clicking your thread group. You can add the Thread name and thread properties that are suitable for your test. I added data as follows:
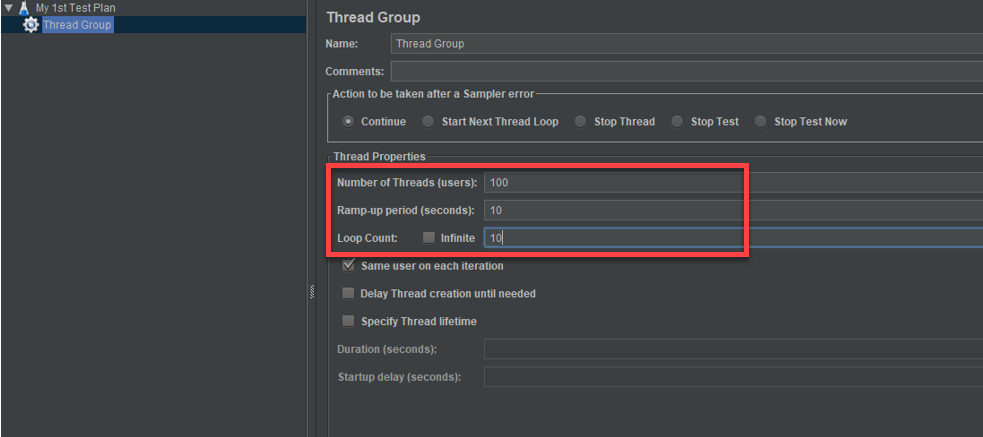
Based on my values:
- Number of Threads: 100 users being connected to our Server application will be simulated.
- Ramp-up Period: The 100 threads will be generated within a period of 10 seconds.
- Loop Count: The test will be looped (repeated) 10 times.
Also, you can define thread time and thread start delay if needed. I have not used those features in order to keep this tutorial simple.
6. Adding JMeter Elements
Elements are individual tests that will be executed as part of our Test Plan.
HTTP requests can be added by right-clicking the newly created Thread Group and selecting Add > Config Element > HTTP Request Defaults.
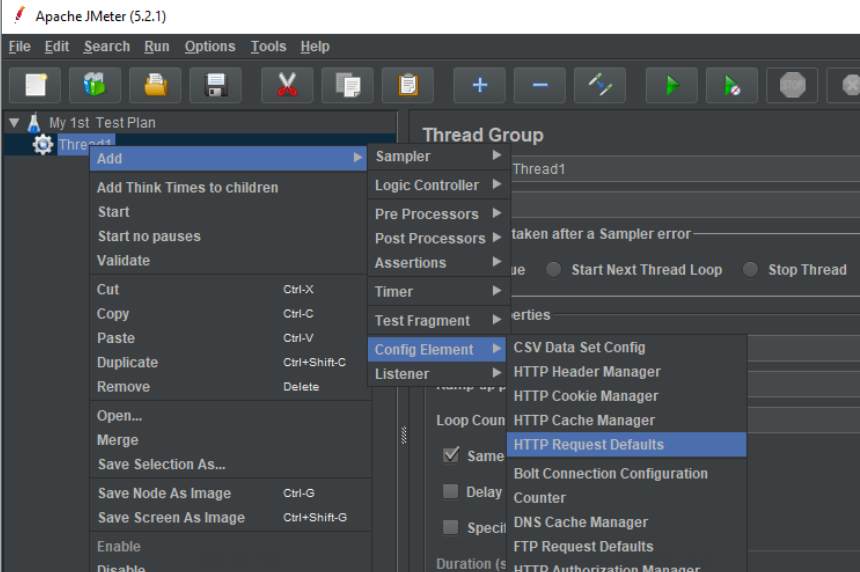
In the HTTP Request Defaults add your website name under Basic > WebServer > Server Name or IP:

7. Making HTTP Requests
You can add an HTTP Request by right-clicking on Thread Group and selecting Add > Sampler > HTTP Request.

JMeter HTTP Request Sampler lets the user send HTTP/HTTPS requests to the webserver that we need to access. If we need to access the trending section on YouTube we can simply add /feed/trending in the path section.
I have not added the path here so that our tests are executed on Youtube.com servers.

8. Graph Result Implementation
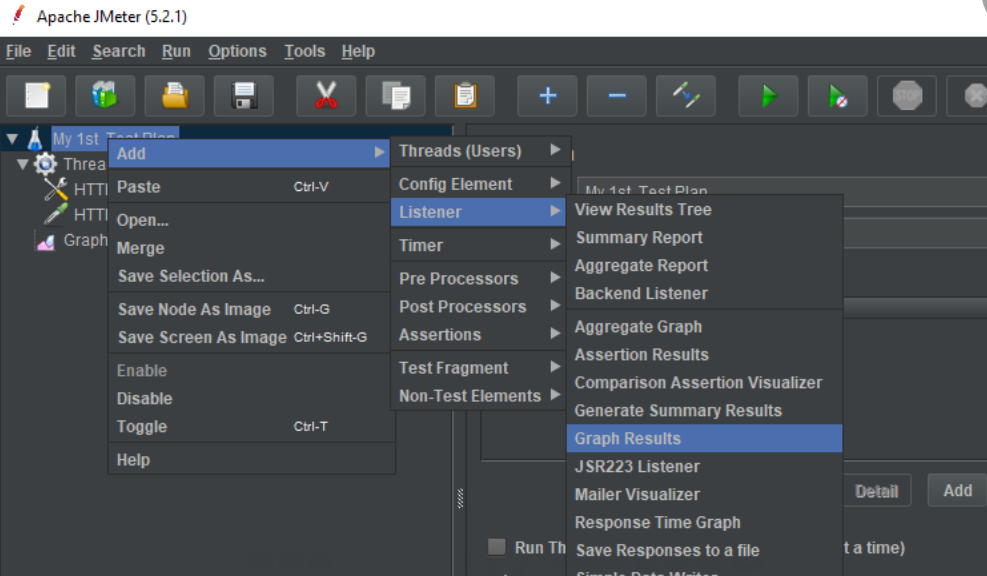
To add graphically viewable results just Right-click the newly created Test Plan, select Add > Listener > Graph Results.
9. Run and Get the Results
Firstly, save your work. Now run your tests and obtain the results by clicking the “Run” button on the Menu Bar. The real-time results will be displayed on Graph Results.
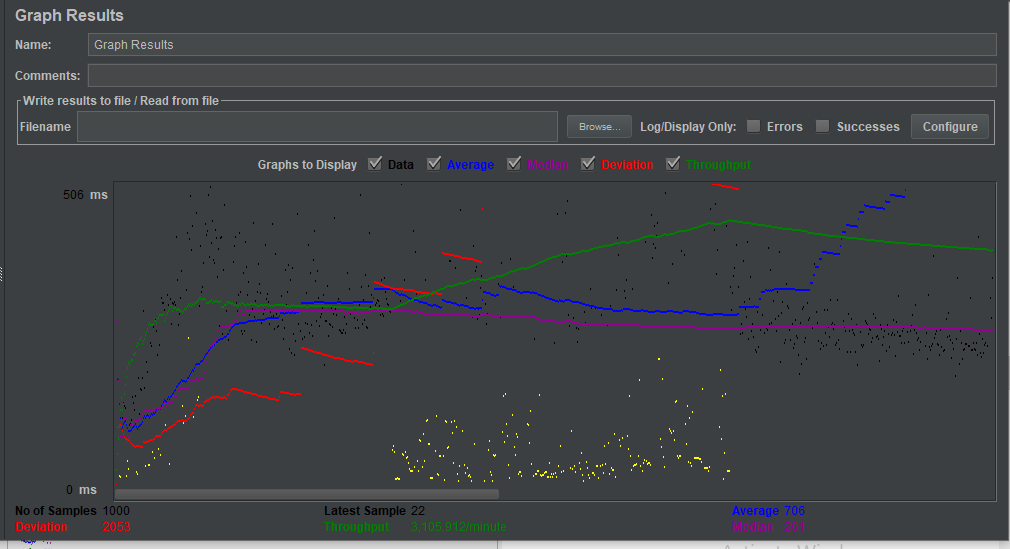
The above results show the results for our tests on youtube.com:
- Red: Shows the Standard Deviation of our results.
- Black: Signifies the number of sample requests that have been sent to the server.
- Blue: Represents the average number of samples sent.
- Green: Represents the throughput of our results. It refers to the total number of requests handled per minute by the server.
Throughput and Deviation are the most important parameters that we can use to analyze our results. If the throughput is high, we can generally assume that the server has performed well, though this is not always the case. On the other hand, if the Deviation is low, we can assume our web application has performed well.
The above graph results show high throughput and low deviation. These results are very good and they are no surprise considering that YouTube is a popular service. It has been highly optimized in terms of both server performance and web application performance.
I recommend that you try JMeter to analyze your web application because of its simple GUI, free open-source nature, support for a variety of server types, and platform-independent nature. It will make your testing process much smoother and more convenient.


